

Highlights of my report on FCRA declarations between 2006-2019
PDF version in the archives page
This text is the synthesis of a 30-page analysis based on a workbook with 60 interconnected spreadsheets, available in the archive. Enthusiasts are most welcome to take up this work, enhance it, complement it or even correct it if need be.
- The first observation is that these declarations are not completed in a conscientious and professional manner;
- funds are supposedly received for one use and often allocated to another;
- end-of-year balances are not carried over correctly to the start of the following year and their carry-over can vary by tens of millions of dollars each year;
- then the simple additions and subtractions often do not correspond to anything, which can lead to fanciful end-of-year balances (in 2014, the disparity was for example $53 million…).
- It seems that the declarations are completed by amateurs who have no idea of accounting and that they are not audited. Which is hard to believe after more than thirty-three years of touring the world. Moreover, the law stipulates the intervention of a chartered accountant and consolidation with bank accounts. So technically the declaration should correspond exactly to the bank statements.
- Most of the funds raised in the name of charitable activities during programmes in the West are in fact allocated to income-generating activities. Indeed, with its for-profit schools and hospitals, the organisation generates a lot of money in India. I will deal with this subject in the next chapter.
- In thirteen years, 53% of foreign funds have been collected for hospital projects while only 13% of these funds have been used for this purpose. Even so, it is about (as mentioned in the statements) “construction / running of hospitals / dispensary / clinic” which are paying institutions extending paid services. We will see later that the hospital (AIMS), supposedly dedicated to providing advanced care to the poor, only devotes itself to them in a ridiculously low percentage – percentage being further reduced by the State subsidies, more specifically to the PMNRF[1], the Prime Minister National Relief Fund.
- The same goes, as we will see later, for specialised schools and colleges, to which 5% of donations are allocated, which are also paying institutions, and even reputed to be expensive compared to the competition. In present-day India, education and health are indeed thriving private sector activities.
- Over the last thirteen years, $130 million (on average 10 million per year) have been declared as collected abroad while only $7.6 million (on average $583,800 per year) have actually been spent on charitable and other emergency relief activities, making it an average percentage of 4% of funds received. However, since averages blunt and weaken reality, let us zoom in on some details:
- from 2009 to 2017, in eight years, 0% of the $67.2 million of declared foreign funds collected were spent on charity…
- except in 2013 when $140,000, or 1.18% of the funds raised that year, were collected for this purpose, whereas a scant $61,400 or 0.69% was reported as spent on emergency aid.
- In general, we have observed that, in the case of emergency relief activities, the organisation spends almost nothing out of its own pocket. It collects funds abroad and transfers them to the field, sometimes adding 1% – a percentage it was probably able to withdraw from other amounts received, since there is often no correspondence between the allocation of funds at the source and on the field[2]. On the other hand, it does not fail to take the merit of humanitarian action and also makes it the basis for the next advertising campaign to attract even more millions for its health and education businesses or to simply increase its capital.
- Having been directly involved in the heart of the organisation, I know how important it has always been for A. to “sell” her charitable activities to raise funds, but I never imagined it to that extent. Behind the propaganda façade, the reality of the generosity of this organisation is this “1%”, while it pumps from foreign taxpayers an average of $10 million per year. That said again, this 1% may well have been taken from amounts allocated for other purposes. In this highly probable realistic case, the generosity of this organisation out of its foreign funds would rather amount to “0%”.
- Let us see what the annual percentage of “funds used” is:
- During these thirteen analysed years, on average, only 55% of all the foreign funds collected were used;
- in 2007, only 31% of the $14.9 million raised was used;
- in 2008, it was 13% of the $24 million raised;
- in 2009 it was… (excluding 3.5 million bank interest) 0.66% of the $7.9 million collected, in other words, only $75,434 used according to the goals and objectives of the NGO. What happened to the remaining 99.34% of the funds? This is unknown.
We do not have proof of their use, but we believe they have been invested. Indeed, the organisation prides itself on bank interest income of up to $3.7 million per year. I let you imagine the capital necessary to obtain such an amount of interest. I have put together a table with my relative estimates which you will find in the appendix. To generate such interest in the West, it would take at least $300 million, while in India where the rates are 5-7% on a fixed deposit account, about $75 million would suffice.
- 8% of the funds were collected to build one or more boarding schools for disadvantaged students but only 3% of these funds were devoted to them;
- 5% of the funds were collected for the construction and maintenance of schools; the organisation added 7%, probably taking the additional funds allocated to other purposes;
- the allocation of funds also seems arbitrary, even if it may partially be the constraints and restrictions posed by the declaration forms. For example, do devotees and foreign charitable institutions know that they are not giving to “charitable activities”, but for “construction and extension of administrative and buildings” as in 2006, 2009 and 2010 for an amount of $13.2 million? Or for the creation of an “endowment fund”[3], as in 2009 and 2010 for an amount of $12.2 million? Moreover, these two purposes are not even reported in the summaries highlighted on the first page of the forms. You have to search the detail of the twenty pages of each declaration to find them. This also shows that the detail and the summary of the declarations are not necessarily matching.
Here are some examples of the allocation of funds that emerge from the declarations: - “Direct Relief International”, a US NGO, has several times given large sums (up to $610,000 in all) which were not allocated to relief activities but to “other expenses”, between 2009 and 2011.
- Did Amma Europe in Belgium donate $1.8 million specifically to fund an endowment fund in 2010?
- In 2011, up to $12.8 million was allocated to “other expenses”. The same goes for 96% of global individual donations for a total of $1.9 million.
- Is the Austrian Benedictine monastery which donated $424,000 in 2011 aware that its donation has been allocated to “other expenses”?
- In 2012, the bulk of funds, totalling $4.2 million, were also allocated to “other expenses”, such as 58% of global individual donations.
- The list is far too long to include here. More information in the detailed report, see appendix.
- In addition, in almost every year, there are large discrepancies between the detail of institutional and individual donations received and the summary reported at the top of the declaration. Sometimes the amounts are negative, sometimes positive. The total cumulative discrepancy amounts to $4.6 million.
- The balances carried forward are all wrong with sometimes astronomical variations totalling $195 million. These are gross accounting anomalies. Carrying over the balance from a previous year when making a declaration is an extremely simple operation. Only once, out of the thirteen years studied, did we find a balance carry-forward from the previous year with only a variation of $33. This leads us to believe that reporting errors may not be the result of simple negligence.
- Other than that, as of 2014 we have noted that the organisation is unable to do simple additions and subtractions which resulted in cumulative year-end balance errors of an additional $70.3 million.
- Sometimes 200% of funds received were used during the year, and this, while still showing a positive end-of-year balance. The disparities are gross, and the scale of the anomalies is phenomenal.
- In addition, officially nothing appears on the proceeds of sales of derivative articles during programmes abroad. During her service, Gail kept notes for each year, for each programme, the total amount received in donations during the ceremony preceding the Devi bhāva as well as the amount of sales. For example, in 1999, more than twenty years ago, she noted that during the fourteen days of stay at the California Center of San Ramon, $32,000 had been collected in donations, the proceeds of the sales represented more than seven times that amount, i.e. $230,000. Compared to donations, the shop sales are proportionately higher in the United States than in Europe, but it certainly represents a few tens of millions. I presume that it is Amma Europe in Belgium which collects the proceeds from the sales of the travelling shop and in the USA, it’s the MA Center. It is interesting to note that we find these amounts allocated at the end of the chain, in the declaration of foreign funds, under various denominations as if they were donations. In other words, these structures seem to exercise a non-profit commercial activity since they transmitted all the funds from the sales in the form of donations to the parent organisation. Thus, in the eyes of the Indian authorities, this money does not come from commercial activities abroad but from selfless donations.
- Finally, nothing is known about national (Indian) cash inflows. Twenty-five years ago, A. already informed me that national income had become significantly higher than international income. These foreign tax returns are therefore probably the tip of the iceberg. But as such, this allows us to have a fairly precise notion of the practices of the organisation and its mis/management.
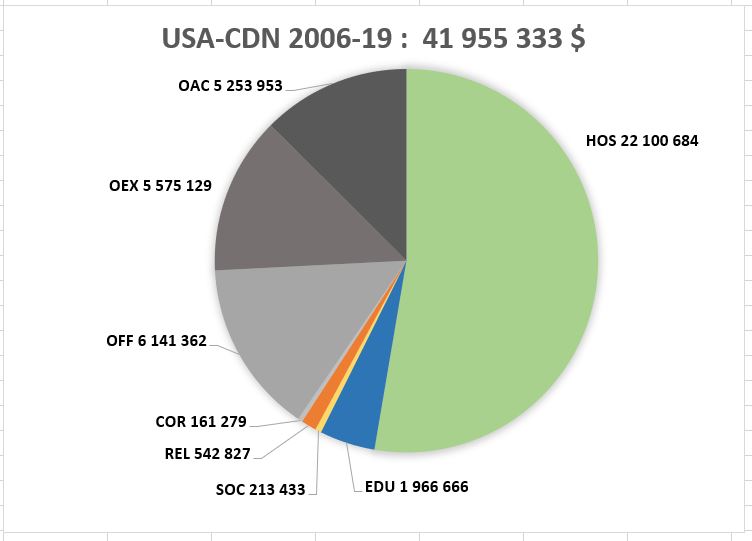
- From 2014 onwards, the declaration form has changed which makes it impossible to compare with other years. So, I have summarised the percentages for the eight years (out of thirteen) between 2006 and 2014 in pie charts below that bring together institutional and individual funds. For the full period up to March 2019, the total revenue is $130 million.
 On the left, you will find the funds received and how they were allocated, and on the right, how these funds were used, “if applicable”.
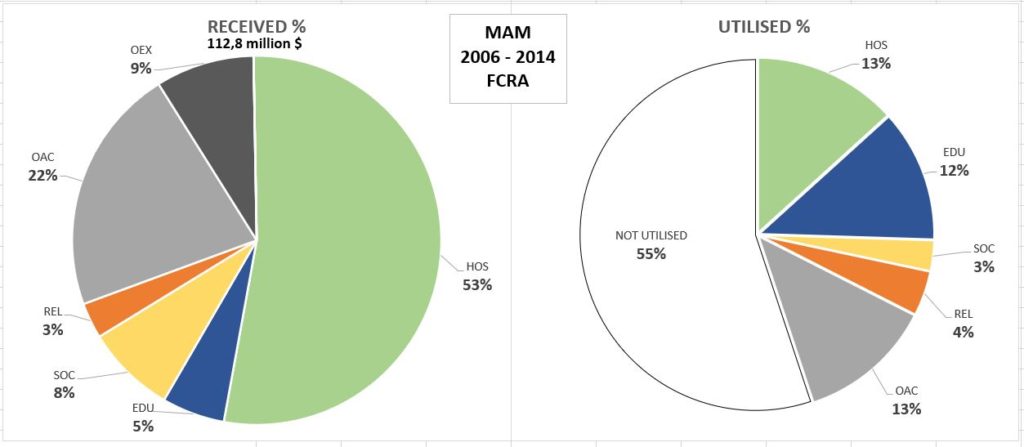
We are looking here at the “figures”, not at the promotion and complimentary propaganda figuring on the organisation’s websites and the advertising brochures shown during the programmes in the West.
Obligations of NGOs and the reality of the organisation
The organisation may have acquired consultative status with the UN, yet it does not seem to have assimilated any of the founding principles of international organisations such as good governance, transparency, accountability, independent auditing and evaluations, respect for ethics and procedures.
The rather sober, less brilliant, even rather cynical reality is the following: on the one hand, $130 million are declared collected from abroad for charity, on the other, only 4% of this amount is used in the field for charitable purposes; 41% of the remainder is used in building an entrepreneurial empire and 55% is banked to generate millions of interests. In other words, when you donate $100, $4 will go to the field, $41 will be for business, and $55 for savings. Call it, fraud, call it deceit, call it breach of trust, misuse of donations, embezzlement, donations harvested under false pretences, whatever you may call it, this is so huge that it defies understanding!
“Let us think about all those devotees who feel ‘loved’…” Gail told me recently, “if that “love” were genuine, would she not return it to them by respecting and honouring their gifts and truly using them for charity, without betraying their trust?”
Not to mention that if she was able to build her entrepreneurial empire allowing her organisation to live comfortably today from its national income, it is thanks to the money of Westerners, thanks to these funds that she received in love and trust and which she used, dare we say, in disloyalty and dishonesty.
So, let us stop foolishly repeating baseless rationalisations and justifications and let us just face the figures: the rate of the institution’s deceit is 96%! But as we know in this world, the greater the shenanigans, the more inconspicuous they are. However, the deception here is much more perverse because it instrumentalises the emotional, love, the heart, the spiritual and all that is noble, towards which people aspire all their life. To deceive the very same people it claims to serve, by affecting both ends of the chain: on the one hand, the devotees seeking love, acceptance, enlightenment and on the other, the destitute, those in misery and in poverty in whose name she goes fishing in the pockets of working people.
The organisation’s websites are highly promotional, there is no mention of accounts anywhere. Small anecdote: many years ago, during A.’s visit to Paris, I had brought her the annual report of the “Restos du Cœur” (a French charity feeding the destitute) that I had received in the mail. It was an A3 sheet folded in two with four pages of report, accounting, graphics with figures and percentages. This type of report is a common practice. I presented it to A., and I argued that this form of transparency would facilitate fundraising by improving the credibility of the institution. Without commenting, she handed it to Balu, 002, director of the institution, who was present at the time. The latter took it with disdain and without uttering a single word, put it down somewhere as he left the room. End of subject.
The world of international organisations, humanitarian organisations, NGOs and the UN is an environment that I know well, having worked in it for twenty years in Geneva, among others within MSF Switzerland (Doctors without Borders), as well as within the ICRC (International Committee of the Red Cross) in Geneva. By way of comparison, a few years ago, MSF Switzerland prided itself of devoting 78% of its fundraising to project beneficiaries, given that such an organisation has much higher operating costs than the institution of A., if only in wages. Even the ICRC, with a different governance and a near-diplomatic status, devoted 56% of its $2 billion budget to the field (and was also reprimanded by the Swiss Confederation, this percentage being considered too low). MSF and the ICRC, given their size, are exceptions here. At MSF Switzerland, there were 200 employees in Geneva and 2,000 around the world. At the ICRC, there were ten times more, at headquarters and around the world. That is a lot of payroll. As a general rule, for smaller NGOs, the standard expectation is that 80% of revenue minimum should go to the field. According to some institutional donors, this requirement can even go up to 88%. An NGO that devotes less than 80% of its funds to projects in the field would be publicly criticised and would no longer be funded. Not to mention that if an NGO received funds for one purpose and used them for another, institutional donors would demand the reimbursement of funds and blacklist the organisation. Moreover, the State would cancel its status of public interest and tax exemption! One has to admit here that the institution of A., is capable of a unique tour de force in the world and even more, neither the donors nor the States are raising any questions.
Donations from affiliated organisations
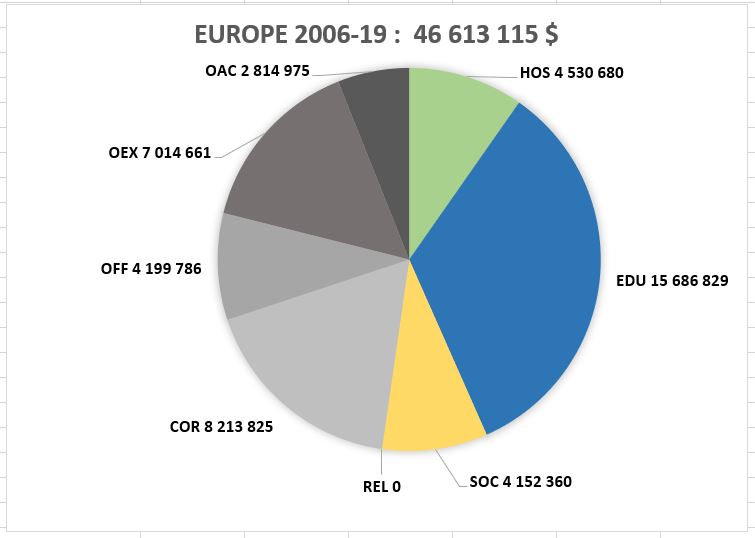
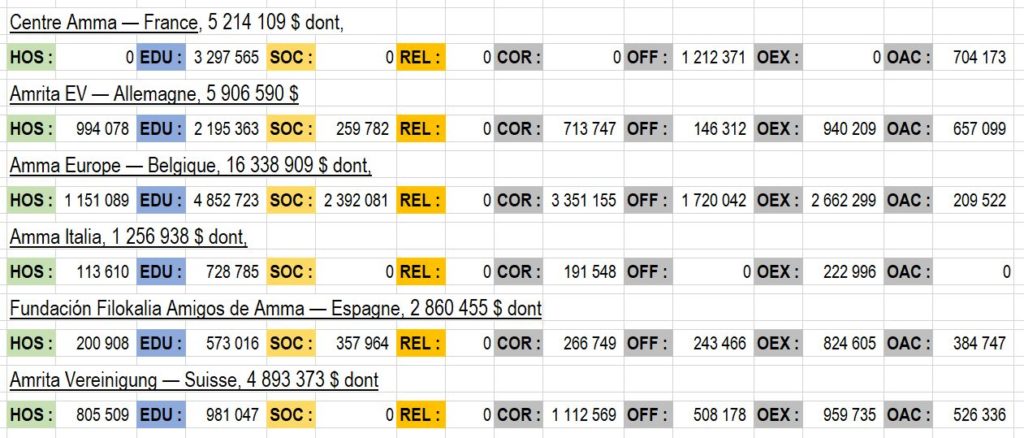
In my analysis report of declared foreign funds, we will find, as already mentioned, the details of what each of the affiliated organisations (other A.-Centres and A.-legal bodies around the world) transferred to the parent institution in India and with what purpose. Here are some examples of what can be found among the twenty affiliated organisations on the European continent. It should be noted from the data that out of the $46,613,115 collected in Europe for the period between 2006 and 2019, nothing seems to have been collected in the name of emergency relief (REL). Let us see some examples of the total funds sent with their allocation:
From these figures, one can see what affiliate organisations have sent / how funds sent have been allocated by the parent organisation, such as:
- the French Centre gave $1.2 million for the construction of offices (23% of its total over 13 years) and 704,000 (13%) as “other activities”;
- Amma Europe donated $3.3 million for an “endowment fund” (20%), $1.7 million for “office construction” (10%), $2.6 million for “other expenses” (16%) and 209,000 (1.3%) for “other activities”;
- and so on; the affiliated organisations that wish to consolidate the detail in appendix with their accounting books can do so with the files available online (see appendix) [4].
Here are the total amounts received in Europe from affiliated organisations and their distribution according to the declarations:
Same thing for the USA and Canada:
Same thing for the whole world:
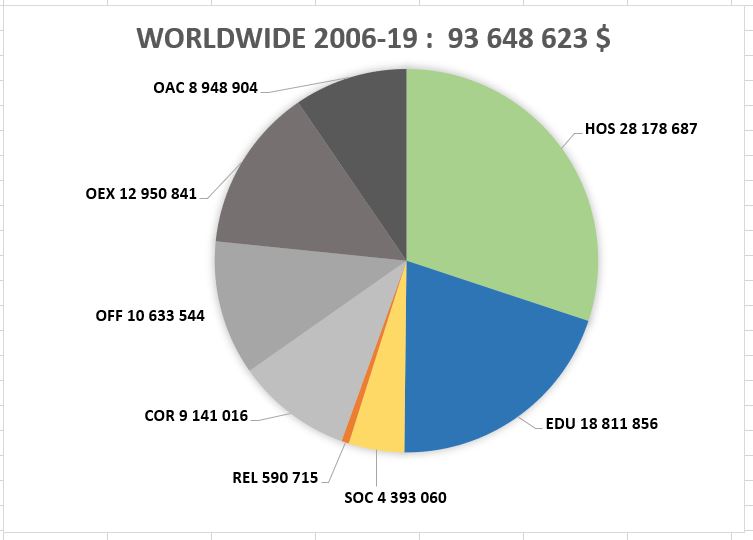
In each of the pie charts, the grey areas are of similar size. This will not be the case with regard to individual donations, as will be seen below.
Aside from this $93.6 million from affiliate organisations, $76 million were donated by other independent organisations and businesses.
Donations from individuals
Here is how the donations collected from individuals around the world, and declared (because they were paid into bank accounts), were allocated. This is $17.6 million over the same period (except 2007 and 2008 when the individual donations were omitted from the declarations – one can only wonder. Why wasn’t this picked up by the authorities? It is therefore eleven out of the thirteen years from 2006 to 2019:
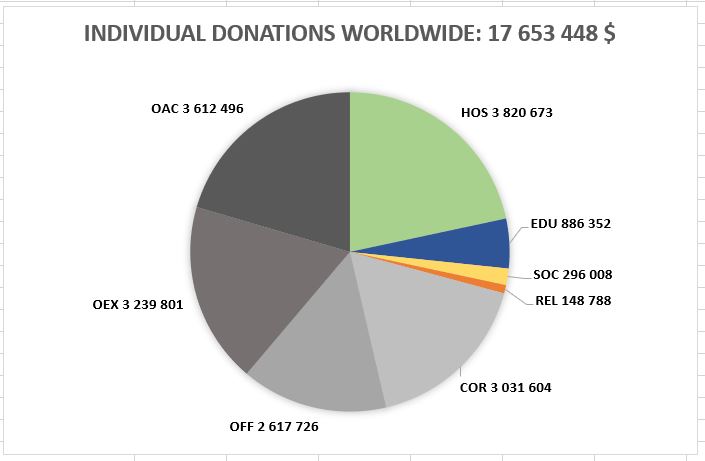
You will find the same thing here, represented in percentages. The purposes are listed on the left; regions of the world on the top: Europe, United States and Canada, Asia, Middle East, and the world, representing the total.
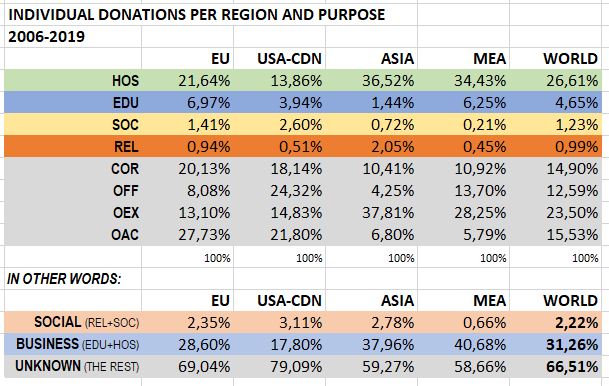
The colour codes are the same. The bottom three lines summarise the table. The figures speak for themselves: only 2.22% of individual donations were allocated to social and humanitarian purposes. In other words, in the period that concerns us here between 2006 and 2019, from your personal and individual donation of say $100 for A.’s charitable works, only $2.22 was dedicated accordingly. The remainder, namely $31 was devoted to strengthening the entrepreneurial activity of the organisation and $66 was either spent on behalf of “other expenses” or on other unknown activities, or simply invested.
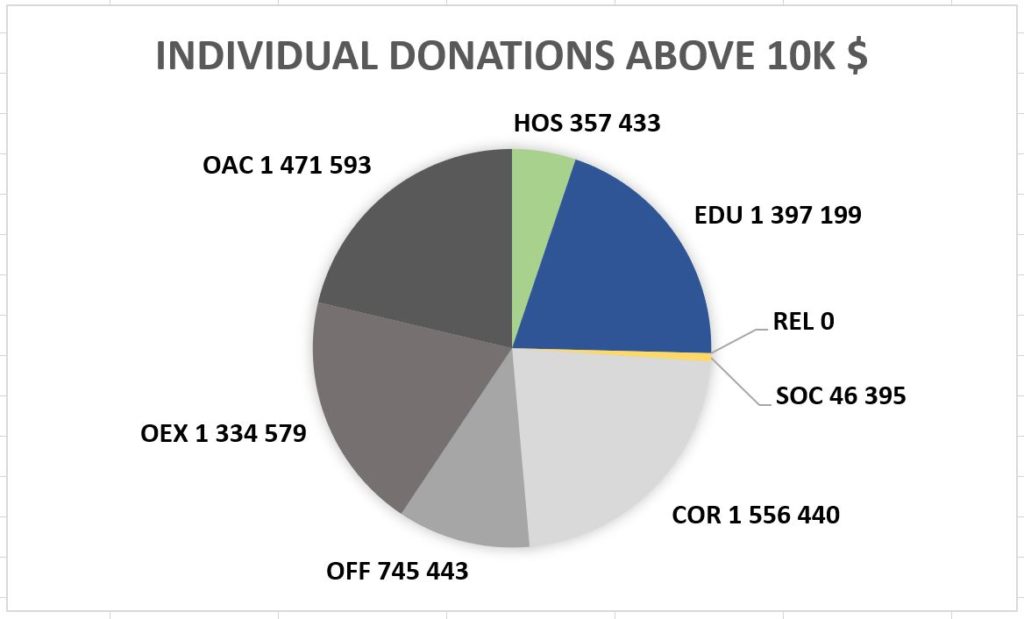
Speaking of individual donations, here is an overview of donations over $10,000 and their allocation: over the thirteen-year period, 286 people gave $6.9 million, some up to 150, 250, or even 400k. The graph shows how these donations were allocated: 5% in social (including 0% in relief), 25% for business and 73% for purposes such as other expenses, other activities, construction of offices and endowment funds. This is the worst chart of the lot: a predominant amount of grey…
You may still have reservations and wish to assume that health and education facilities are part of the charitable activity. Even if this were the case, look at the contrast between the coloured and grey parts on the charts. Though this would improve the image, the bulk of the problem visible to the naked eye would essentially remain the same. Namely the massive appropriation of donations for purposes other than the stated social and humanitarian objectives. THE END.
___________________
NOTES
[2] Indeed, funds received for a goal X can be spent for a goal Y, without relation between the two. I am not talking here, for example, of allocating funds collected for flood victims and devoting them to drought victims. No, as we will see, these are often funds raised for “humanitarian” purposes and used for “entrepreneurial or savings” purposes.
[3] https://corporatefinanceinstitute.com/resources/knowledge/trading-investing/endowment-fund/
It all depends of course on how this fund is used. Considering the lack of transparency of the declarations of this organisation and the way funds are managed, reservation is recommended.
[4] Moreover, the team from Embezzling the world finds discrepancies between the declarations of the Californian MA Center with the FCRA declarations of the organisation in India. The US Center declares millions of dollars as donated, when the MA Math FCRA form mentions 0 dollars received. The team invites every Center in the world to do the same consolidation. https://embezzlingtheworld.blogspot.com/2015/01/financial-discrepancies-between-indian.html

This post is also available in:
![]() Français (French)
Français (French) ![]() Deutsch (German)
Deutsch (German) ![]() Italiano (Italian)
Italiano (Italian)